19.07.2024
Евгений Лебедев
250

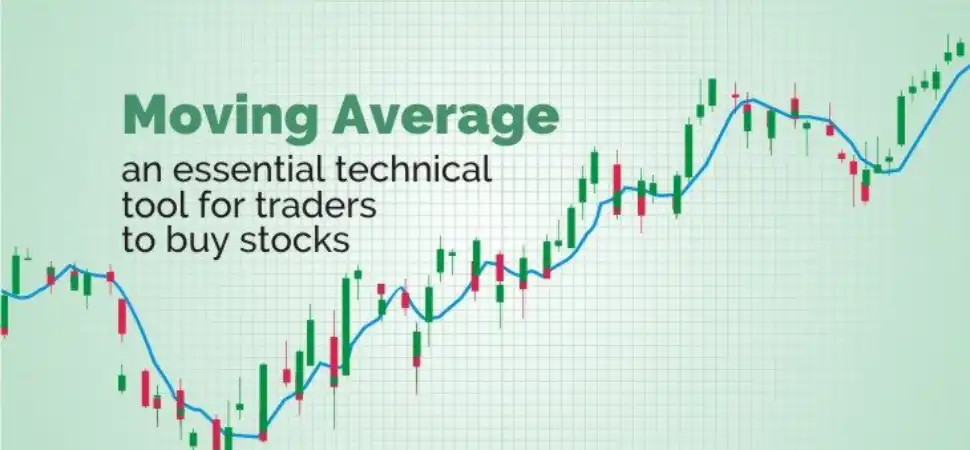
Moving averages are a trend indicator that tracks the price of an asset over a certain period of time and displays it as a line. This smooths out price fluctuations and gives traders a general idea of where the trend is heading. Using moving averages, traders can identify buy and sell signals. Technical traders often claim that the trend is their friend because they believe that an asset that is going up is more likely to continue to rise and conversely, an asset that is going down will continue to fall.
Moving averages offer traders several advantages. One of them is that averages help to identify trends in the market, which makes trading decisions easier. They can also be used to identify support and resistance levels in the market, which helps minimise risk in trading. Additionally, moving averages are an easy-to-use tool that is widely used in the trading world, so it's easy to find information and resources to learn how to use them effectively.
To create a chart with simple moving averages, select a time frame. The time frame can be any period of time including minutes, hours, days, weeks or months. As an example, let's take a 20-period simple moving average on a 5-minute timeframe. The moving average averages the price of the last 20 5-minute candles. A moving average with a period of 20 can help a trader identify short-term trends.
Types of moving averages
There are different types of moving averages, but the most commonly used are the simple moving average (SMA) and the exponential moving average (EMA). A simple moving average is an unweighted moving average, meaning each day in the data set has equal importance and is weighted the same. As each new day ends, the old data point is discarded and the new one is added to the beginning. The main difference between an EMA and an SMA is that the old data points are never moved beyond the mean. That is, the old data points retain the multiplier even if they are outside the length of the selected data series.
Moving averages are used in trading to identify trends in the market and to determine possible entry and exit points. EU, for example, if the 50-day moving average is above the 200-day moving average, this indicates an uptrend in the market and can be a buy signal. Different combinations of moving averages are also used to get more accurate trading signals. For example, a combination of the 50-day EMA and the 200-day EMA can be used to identify changes in the market trend.

Trading strategies with moving averages
Let's look at an example with a moving average with a period of 20. A buy signal can be a price breakout above the average. You can take advantage of a prolonged price rise and exit when the average is broken by sellers or you can exit in scalping style when the price moves far away from the average. The risk is that price sometimes breaks the average unnoticed and then reverses because it has not confirmed the breakout is correct.
Another buy signal may not be a breakout, but a bounce or pullback depending on the situation. This occurs when the moving average acts as support or resistance. When price reaches the moving average and then bounces or pulls back, this movement can be used as a buy or sell signal. Moving averages can also help traders understand when to go short or put. For example, if the price rises to the moving average and pulls back, this can be a sell signal.
Moving averages require the use of two averages for different periods on the same chart. These two averages can be a 50-period simple average (medium-term) and a 200-period simple average (long-term). A potential buy signal occurs when the medium-term simple average crosses above or below the long-term simple average. The triple crossover of moving averages is a strategy widely used by traders. It uses 10-, 25- and 50-period simple moving averages. The signal is given when the 10-period average crosses the 25-period average and then the 50-period average. The entry is made in the direction of the 10-period moving average.
Important notes
Looking at a moving average on a short time frame can be very useful, but it does have its drawbacks. One of these is fluctuations. Fluctuations are when price crosses the average, giving one signal, and then quickly reverses, giving the opposite signal. A moving average with a period of 20 usually shows more fluctuations. Therefore, some traders prefer to use moving averages with longer periods, such as 40, 50 or 200 periods. These longer periods show fewer buy and sell signals.
The main disadvantage of any simple moving average is that it is slow to reflect price changes because each period is given equal weight. To avoid this, consider using exponential moving averages. These types of averages treat recent data as more significant and give it more weight. These averages react much faster to price changes and this is more beneficial for short-term traders. It is also important to note that moving averages do not predict future results, they only confirm established trends.
Conclusion
Moving averages are an important tool in any trader's arsenal. By using them, traders can make more informed decisions, which greatly increases their chances of success. However, like any other tool, moving averages have their limitations and require careful analysis and proper application. The key to successful use of moving averages lies in constant learning, practice and a willingness to adapt your strategies depending on market conditions. Moving averages will be a powerful tool for you if used correctly and in conjunction with other analysis techniques. By putting your knowledge into practice and avoiding common mistakes, you will be able to improve your results and achieve stable profits in the Forex market.

/ Reviews