01.04.2024
Евгений Лебедев
435

Trading in the stock market is a short-term way of investing, in which a trader relies more on chart analysis than on fundamental analysis. Let's take a look at what a Forex chart is and understand how to apply it to trading.
What a Forex chart is
A Forex chart is a chart that shows the historical price of a currency pair. A stock chart allows a trader to visualise the recent or past evolution of a financial instrument over time. A real-time Forex chart also allows you to follow the current price of an instrument live. Traders use Forex charts to perform technical analysis (or chart analysis) and find trading opportunities in the stock markets.
Types of Forex Charts
- Line Chart: This is the simplest stock chart that displays the closing price of an instrument using a curved line;
- Histogram: This is a trading chart where each bar represents a specific time frame, such as an hour. The bar shows the closing price as well as the opening price, the highest and lowest price for the past hour;
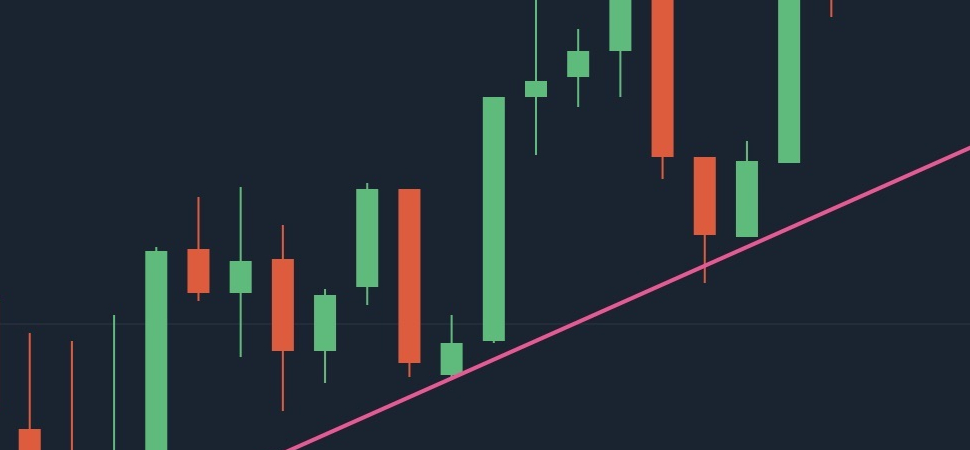
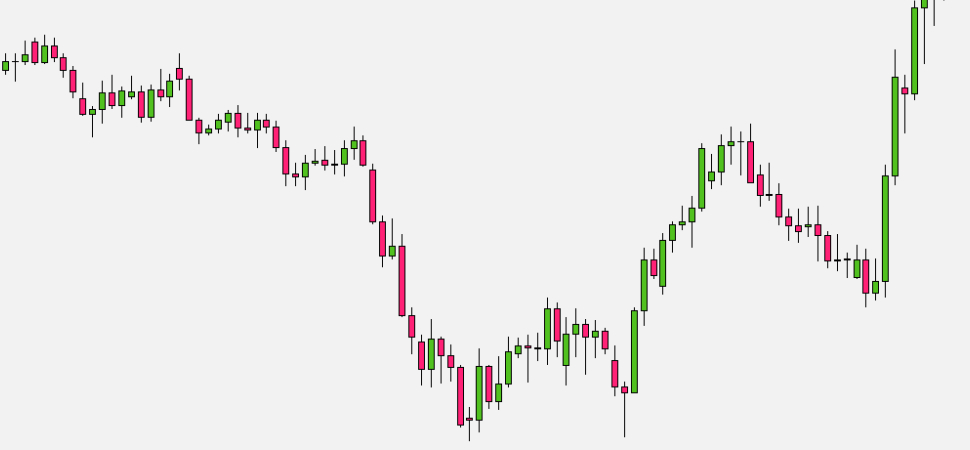
- Japanese candlestick chart: similar to the previous chart, but with candlesticks instead of bars. It provides the same information but is more visual and easy to read.
Traders most often use the candlestick chart for trading as it is the best way to read the chart. Japanese candlesticks are also the most effective for fully analysing a chart.

Chart analysis in trading
Forex trading, unlike investing in stocks, is usually seen as a short-term investment rather than a long-term investment. Short-term refers to the fact that the assets purchased are only held for a short period of time, from a few days to a few minutes. This is in contrast to long-term investing, where an investor may hold a stock for months or even years.
Because of its short-term nature, trading relies more on chart analysis than fundamental analysis. Indeed, the shorter the investment horizon, the less important the state of the economy surrounding the instrument.
Technical Analysis
Technical analysis is based on the technical aspect of the market and prices. It uses only Forex charts. Traders use charts as well as mathematical and statistical indicators to perform technical analysis. The conclusions drawn from the analysis help them make decisions on their positions in the stock market.
In a sense, a Forex chart is a trader's raw material, on the basis of which he builds his trading strategy and makes buying or selling decisions.
Where to find a Forex chart
It is easy to find Forex charts on the Internet, allowing you to observe the trading history of a particular instrument. They are offered by stock market websites. However, to get a full-fledged Forex chart in real time, with different types of curves, the best solution is to download a trading platform. Moreover, it will provide you with all the charting tools you need to learn technical analysis and stock market trading.
Forex charting is an integral part of a competent strategy for Forex trading. Analysing charts requires discipline and care as it is a short-term investment. Understanding how to interpret Forex charts and apply technical analysis techniques is essential for successful Forex trading. By mastering these skills, traders can improve their ability to identify profitable trading opportunities and effectively manage risk in the dynamic world of currency trading. Knowing how to work with charts also increases sensitivity to further market developments and enables you to think ahead, allowing you to properly assess all risks.

/ Reviews